Analyst Performance Dashboard
Problem Space
This was a validation of an analyst performance dashboard (called Moneyball Dashboard, shown left) to determine analysts’ motivation to change their behavior based on PO selected metrics. The top left quadrant addresses these metrics of investor behavior, with the remaining three quadrants showing the expected returns on their current portfolio.
The PO’s hypothesis was that the investors would notice the comparison of their behavior to other analysts’ behavior on metrics such as research notes written, readership, etc. and would want to alter their behavior in the future based on this information. For example, they would be motivated to increase the number of research notes they would write in the future based on the comparison shown.
My Research Plan
To validate the Moneyball dashboard, I worked closely with the POs to determine their hypothesis, goals, and signals. These signals were user behaviors we would look for as indicators that the prototype was successfully communicating the comparison of analyst behavior to the users.
Based on this information determined with the PO, I made a detailed usability testing script (shown right), which qualified the signals into desired user behaviors and actual user behaviors, so we could see if the users were comprehending the prototype in the way the PO intended.
I made this script in a format that could seamlessly be used to fill in during the user test, and also in a way that would visually reflect the qualitative results of the test in the final column.
Findings
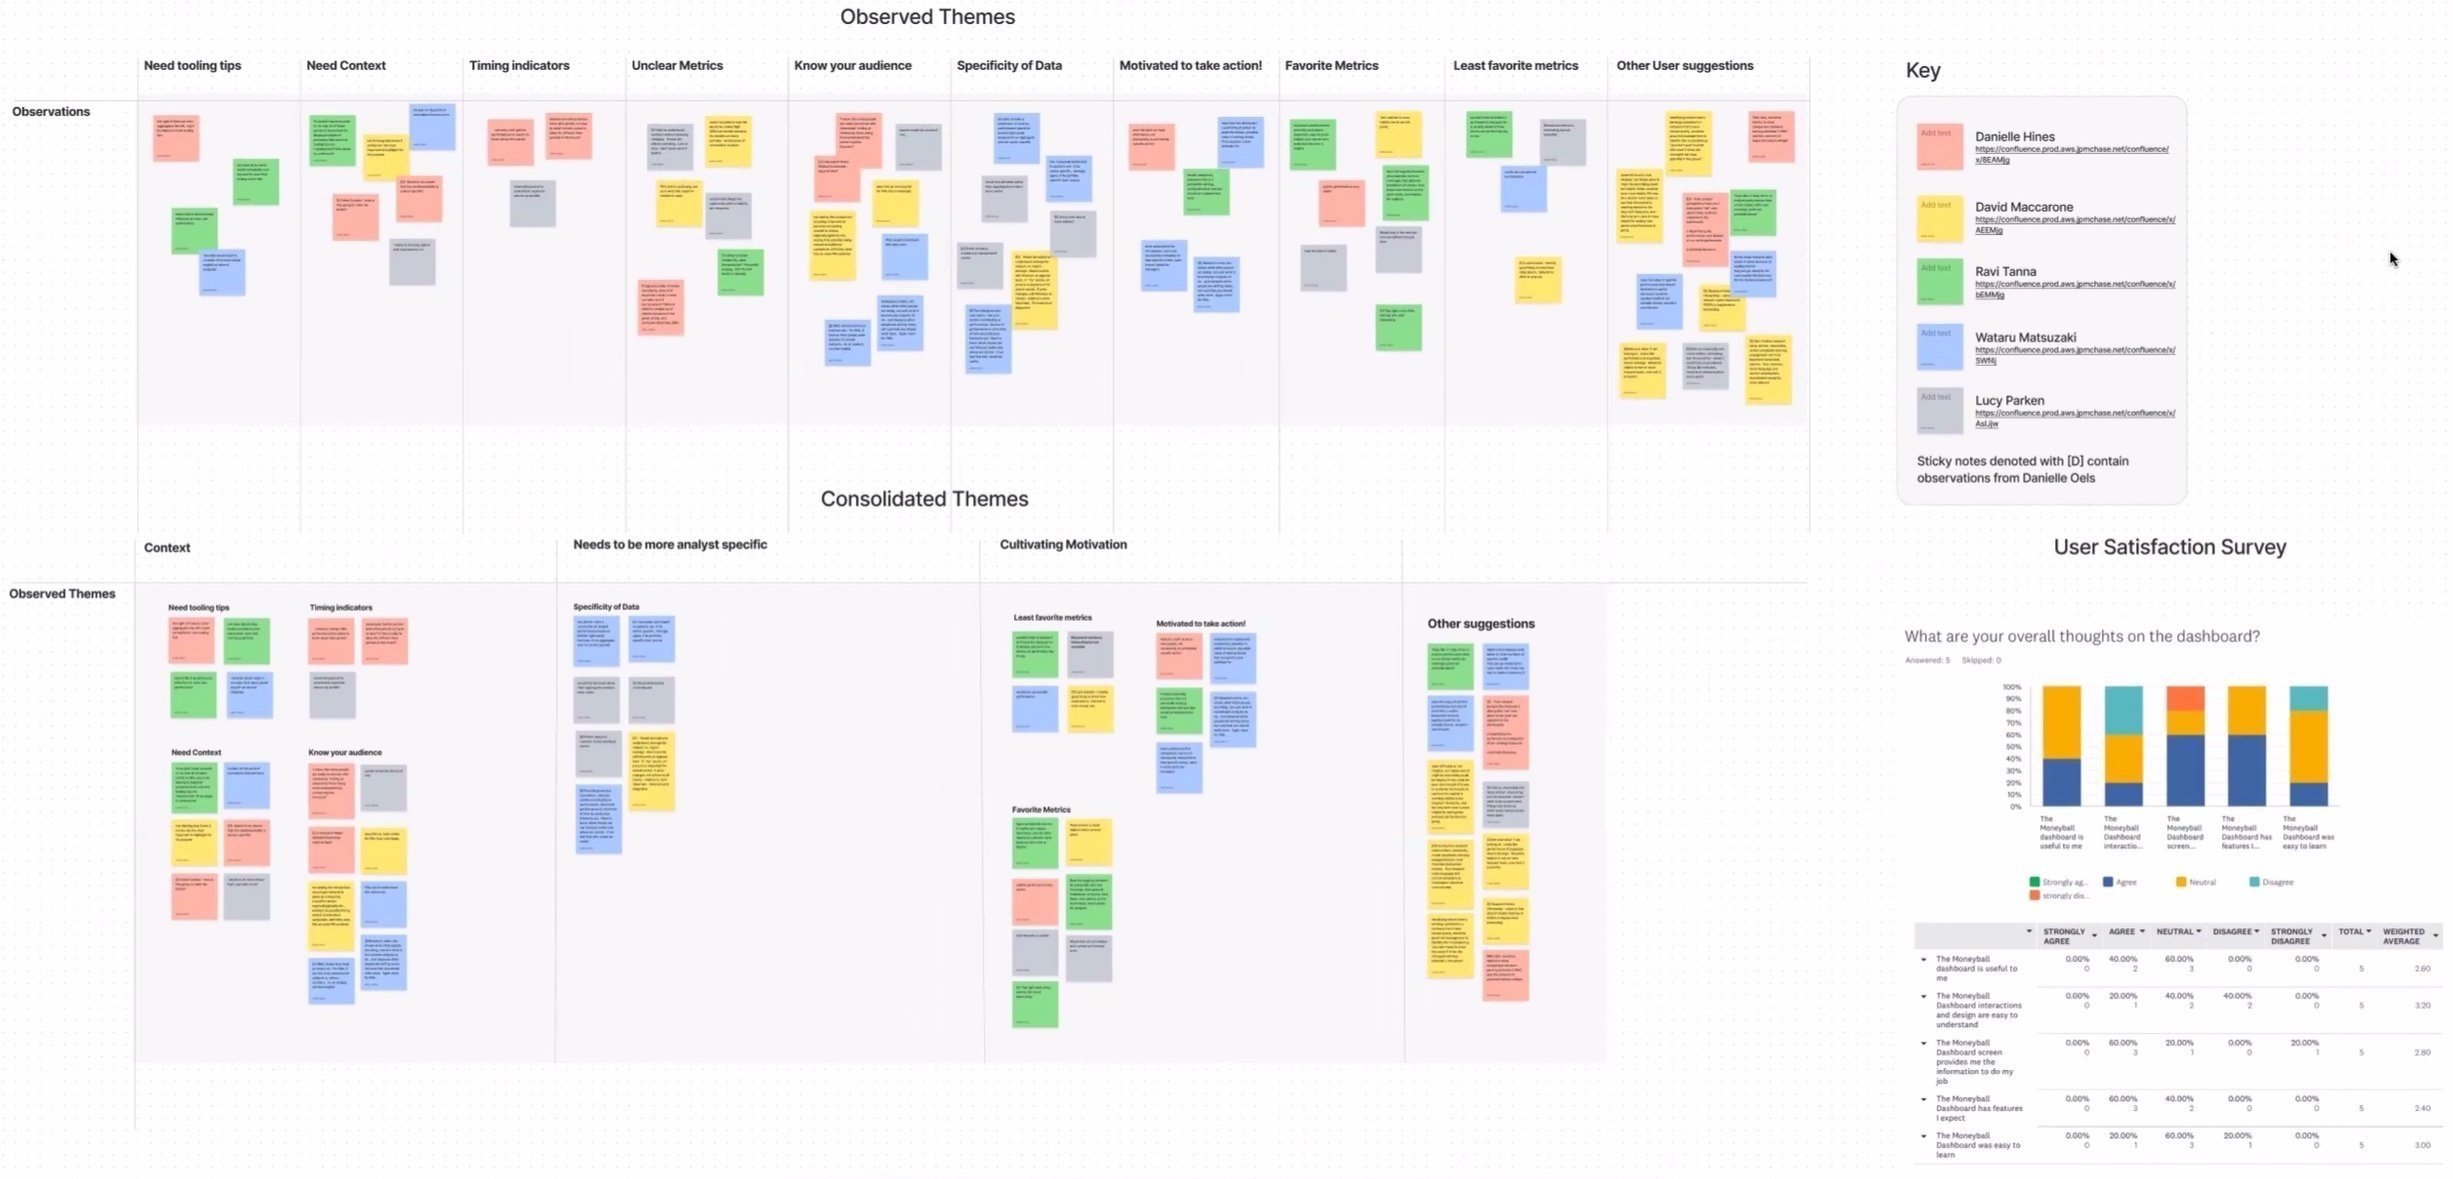
After the user tests, I made this Figjam (below) which organizes the observations, color-coded by user. Then it further refines the observations into themes which I relayed to the PO as part of my recommendations for the next design iteration. Also shown on this Figjam in the lower-right corner are the results from the User Satisfaction Survey, which quantifies the overall review of the dashboard prototype from each user filling out the survey at the end of the usability test.

Recommendations
Early user tests showed analysts were not motivated by performance metrics on dashboard, based on this, I indicated to PO that with the goal of resource preservation, we should halt user tests and delay production early. Insights gained during these tests were vital in shaping next iteration of dashboard design (shown below).


